Category: WebODM

The road to run everywhere: Native WebODM on Windows


One of the cool things about open source software is that it has a tendency to eventually run everywhere. If you have the source code available and certain constraints allow it, with sufficient time a port can be made to different platforms. This is not always the case with proprietary software, where the vendor decides which platforms to support.

In the beginning, ODM could only run on Ubuntu Linux. Later, we opted to leverage docker, which is an amazing (yet confusing) technology we use to bring many of the OpenDroneMap tools to other platforms such as MacOS and Windows. The docker abstraction allows us to focus on building the software without worrying about the platforms. If you can install docker, you can run OpenDroneMap software. Simple. But not without issues. Especially on Windows, docker has several quirks.

We initially delayed efforts to make a native port to Windows for two main reasons:

  • To focus developer time on quality of outputs, speed and features.
  • Previous attempts at making a Windows native port (2 of them across 3 years) failed to yield a working prototype (and lots of lessons learned).

Third time is the charm. I’m pleased to announce that starting today, you can run ODM, NodeODM and WebODM entirely natively on Windows. Even without docker. So where/how can you install it?

This was no easy feat. Let me tell you a bit about the challenges we encountered:

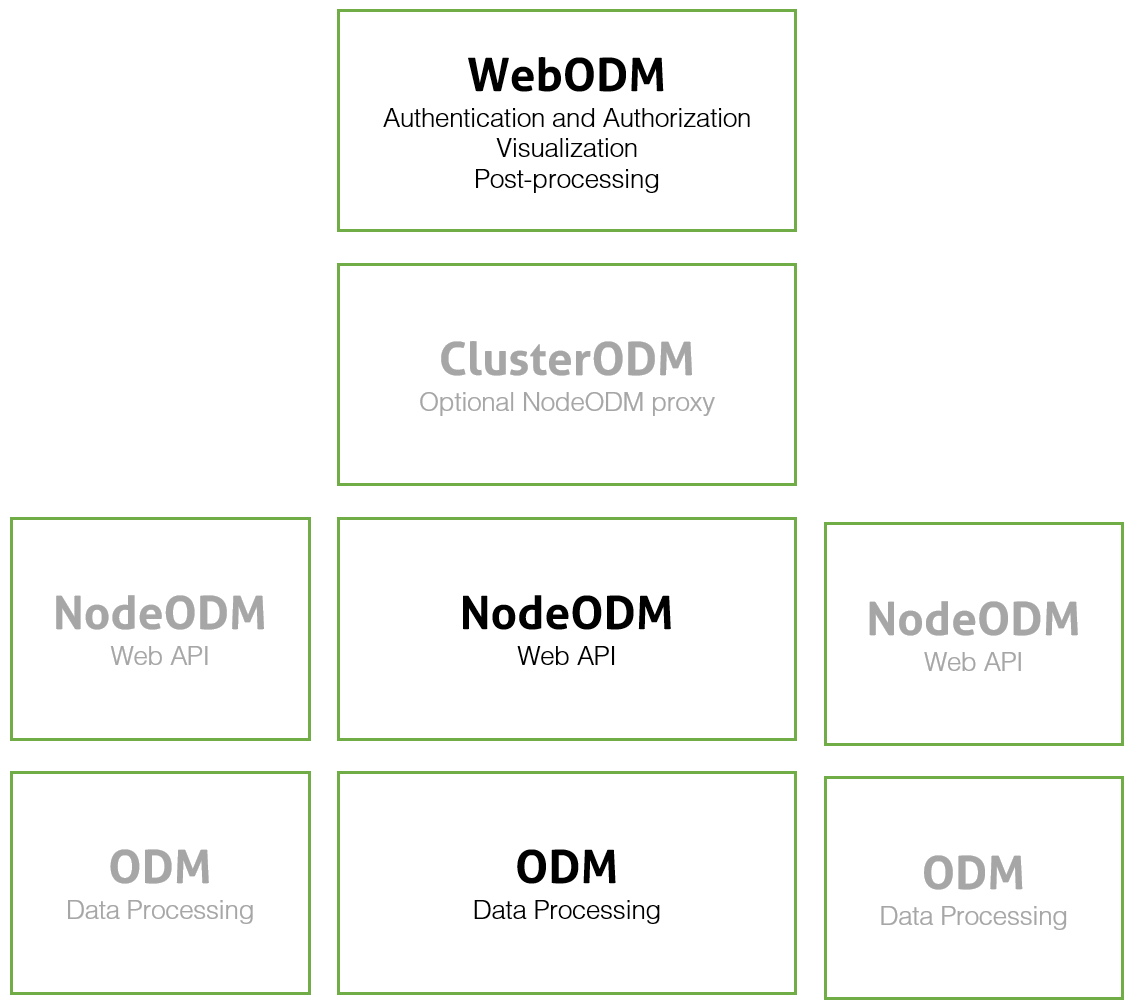
  • ODM has a several primary dependencies (OpenCV, OpenSfM, mvs-texturing, PoissonRecon, PDAL, untwine, entwine, GRASS, OpenMVS, dem2mesh, etc.). These dependencies in turn have in some cases lots of other dependencies.
  • Most of these dependencies were/are written with non-Windows systems in mind.
  • Path handling requires special care on Windows. For example, you cannot create symbolic links on Windows, unless you have administrative permissions (that’s a no go). Paths have backward slashes instead of forward slashes. Single quotes are no good for wrapping paths with spaces in Windows shell commands and functions such as pipes.quote in Python will use single quotes. CTRL+C will prompt the user for a confirmation to terminate a process (instead of just terminating the process), which will hang forever in headless processes like NodeODM.
  • Building Python packages from source code (which ODM requires) leaves several hard-coded paths in our packages, making deployment to other machines tricky.
  • Python virtual environments weren’t meant to be used for deployment (they also have hard-coded paths). But ODM needs a dedicated Python environment to run.

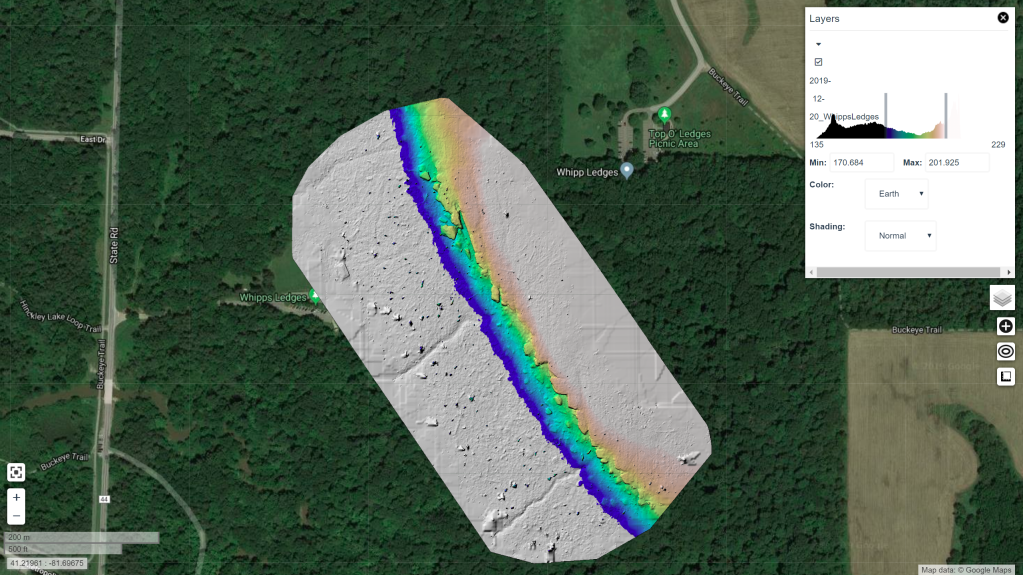
On the plus side, we had already proven last year that the user interface could work natively on Windows:

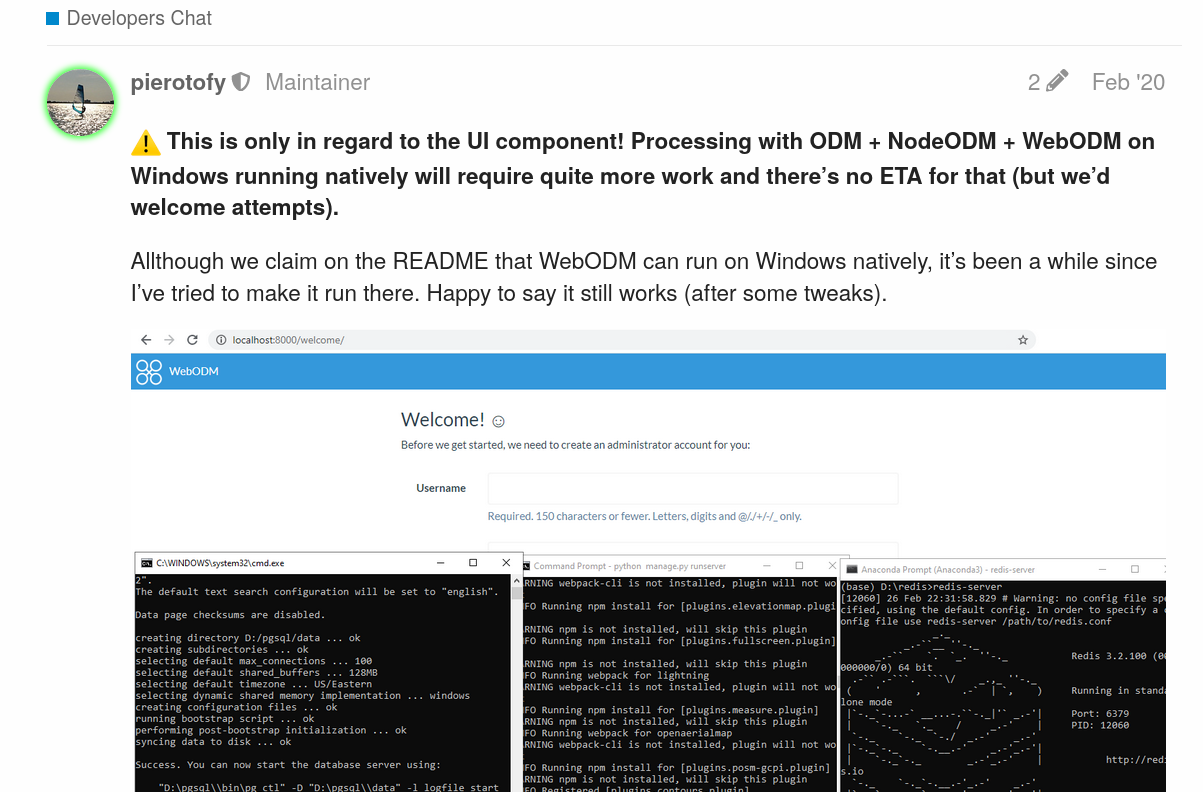
So all that remained was to get the ODM and NodeODM components to work too.

  • We set off to build each major dependency (and contributed several patches to other upstream FOSS projects in the process). We used a tool from Microsoft, VCPKG, to help us build several secondary dependencies for the projects that needed them. This was probably the hardest and most time consuming task. Libraries missing headers, architecture set instructions problems, pre-processor define issues, runtime dependencies not being found, path resolution issues, CMake variable propagation troubles. The list goes on. But divide and conquer, lots of coffee and one by one, we managed to build them all (the entire saga can be read here, thanks to all the community members that followed the process and gave encouragement along the way).
  • We refactored/cleaned up the directory structure and eliminated the build directory in the process, allowing us to keep all of our dependencies in a single SuperBuild/install directory. This made it easier to package the software in subsequent steps.
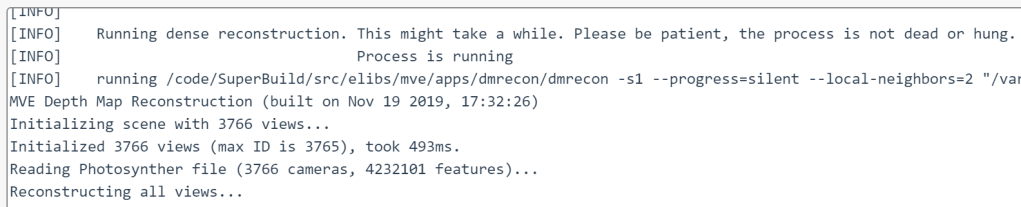
  • We fought the idiosyncrasies of Windows Batch scripting and the Windows shell with some clever tricks to enable a user to simply run: run d:\my\dataset from a command prompt (the ODM Console) and allow to cancel it via a CTRL+C.
  • We hot-patch several hard-coded paths as part of the ODM startup process to make sure our Python modules work as expected.
  • We rewrote the cutline computation algorithm in Python instead of using GRASS, which allowed us to shed some space requirements (and improve performance).
  • We wrote an installer script using InnoSetup (another awesome FOSS) and we got pretty clever to automatically sign the final installer with a code signing certificate (otherwise Windows and other AV software would complain).
  • Lots of testing, which yielded its own set of problems, like undefined behavior in MVE/libjpeg causing a file descriptor leak due to C/C++ exception throwing, which were resolved after some debugging.
  • With ODM working, we turned the page to NodeODM. Luckily, NodeODM is a relatively simple piece of software and is written in portable NodeJS. Save a few minor and not so minor issues, we managed to use nexe to generate a portable executable for Windows. Here we found out that Windows exit codes do not propagate well unless you explicitly call exit on every Batch script (but that breaks console-based workflows), so we wrote some clever workarounds.
  • With NodeODM and ODM both working, the path to full Windows native WebODM was finally possible. Using the same technique that we explored last year, we generated a single executable setup that installs everything that you need. We finally improved the Desktop Mode capability of WebODM to give a more native feel to the application, which remains a web-based application running under an Electron wrapper.
  • We finally built an automatic updater system to allow people to check for the latest version of the software.

So there you have it: Windows native WebODM.

What does this mean for docker? Nothing. Docker is and will continue to remain a core part of our toolset and deployment mechanism. This is simply another way to run WebODM that we hope you will enjoy.

WebODM and the OpenDroneMap Ecosystem


With the release of a native installer of WebODM for Windows, we have been getting some questions about what does this mean? Per Piero’s blog:

Ok, admittedly this requires that you have a processing node running NodeODM somewhere else, as we still haven’t managed to compile/run the full processing pipeline natively on Windows, this is just the user interface, but it’s a really important step toward full native support for Windows (which we have long-term plans for).

https://www.opendronemap.org/2020/03/webodm-now-available-as-a-native-windows-application/

The underlying photogrammetry tool, OpenSfM, is not (yet) able to be compiled on Windows due to dependency issues. Mapillary is doing a major rebuild and removing dependencies, so it may get easier in the future to run the full OpenDroneMap stack on Windows. What do we mean by the full OpendroneMap stack? Something like this:

WebODM itself provides authentication and authorization, visualization, and post-processing. It is the graphical user interface to OpenDroneMap.

Underneath WebODM runs NodeODM. NodeODM is a tool to expose OpenDroneMap processing to a web interface and application programming interface, but doesn’t provide all the user facing parts that WebODM does.

And ODM itself is the piece that does the processing of the data. If you use the command line version of OpenDroneMap, this is probably the tool you are using.

So with the new Windows installer, you get the top of that stack. You get that great interface. You can then connect that with your own autoscaling ClusterODM or NodeODM instance on a local or cloud instance or connect it with WebODM Lightning network, which is a NodeODM setup maintained by Piero’s company UAV4GEO.

Need help setting up a ClusterODM instance? Reach out here:

https://community.opendronemap.org/c/help/clusterodm/

It’s really satisfying to set up your own autoscaling cluster, if you are into that sort of that thing. If not, you can set up a local or cloud NodeODM instance. That is as simple as running a docker command. Or, the simplest solution of all is to sign up with WebODM.net. One of the great wonders of free and open source software is we have lots of choices.

Reminder: if you use ClusterODM, it does have a different license than the rest of the OpenDroneMap ecosystem. It is licensed as GNU Affero General Public License v3.0, so any changes you make to it have to be shared via the same license with your users.

WebODM Now Available As a Native Windows Application


Long time ago, when WebODM was still in its infancy, Windows was still my (Piero’s) primary development platform. As such, the very first versions of WebODM used to run natively on Windows, without docker. But as time went on, with docker entering the development/release process, Windows compatibility was placed aside and focus was shifted on getting docker to work less painfully on Windows (spoiler, it’s still painful).

Despite knowing that in theory WebODM could work natively on Windows , I don’t think anyone attempted to prove it. We’ve added a lot of stuff to WebODM since its old Windows-first days. Dynamic tiling, GRASS engine, background worker processes, message brokers, plugin systems, Python environments… none of which take Windows as a first-class citizen.

Curiosity… would it still work?

Well, I’m happy to report that, after some tweaks, the answer is

Thank you Keebler Elves! | nightshade

Not exactly a trivial endeavor, but the result is quite seamless:

  1. Run the setup.
  2. That’s it, there’s no other steps. Just run the software.
image
image

Ok, admittedly this requires that you have a processing node running NodeODM somewhere else, as we still haven’t managed to compile/run the full processing pipeline natively on Windows, this is just the user interface, but it’s a really important step toward full native support for Windows (which we have long-term plans for).

If you are used to the docker experience of installing WebODM, you might be seriously impressed by the simplicity of this new option.

The engineering feat is also quiet impressive, because getting WebODM to run natively requires:

  1. A web server
  2. A message broker service
  3. Multiple worker/scheduler processes
  4. A database (with PostGIS)
  5. A single Python environment
  6. An installation of GRASS
  7. Lots of smaller Python/Node.JS dependencies to work correctly

In particular, issues of compatibility had to be solved between GRASS’s Python environment and WebODM’s virtual environment, as the two can run in the same process space, but Windows does not like that at all. Piggy-backing GRASS’s Python environment to run all of WebODM’s other functions turned out to be a good solution and removed the need for multiple Python environments.

The application setups all of these requirements (with careful consideration for security as well, where strong passwords need to be set to protect from untrusted local users), launches the necessary services in the proper order and wraps the application using Electron. Voila’!

The windows setup is freely available from https://webodm.net. This is a first release, so a few issues are expected. If you find them, please report them.

Drone mapping for the rest of us


One of our community members, Zach Ryall, has covered OpenDroneMap in a recent article for AOPA (Aircraft Owners and Pilots Association).

Maps and mosaics are among the most powerful products a drone camera can produce, but producers of polished, user-friendly software made for professionals aren’t giving freebies anymore. Open-source software offers hobbyists and soloists an affordable alternative.

You can read the full article here: https://www.aopa.org/news-and-media/all-news/2020/february/28/drone-mapping-for-the-rest-of-us#

Small correction on the attribution of credits from the article: OpenDroneMap was founded by Stephen Mather and not me (I’d like to get this record straight). If it wasn’t for Steve’s commitment and vision for the project, we wouldn’t be reading this post (or this article, or anything OpenDroneMap related for the matter).

Stone Town Digital Surface Model


Reposted from smathermather.com


Thanks to the tireless work of the folks behind the Zanzibar Mapping Initiative, I have been exploring the latest settings in OpenDroneMap for processing data over Stone Town. I managed to get some nice looking orthos from the dataset:

But, excitingly, I was able to extract some nice looking surface models from the dataset too. This required using the Brown-Conrady model that recently got added to OpenSfM:

This post is a small homage to the late his Majesty Sultan Qaboos. Given the strong affinity and shared history between Zanzibar and Oman, it seems fitting to post these.


Checking a running process in WebODM


reposted from smathermather.com

Edit: the dreaded “Reconstructing all views” message has been replaced with a progress monitor! But, how to dig into the back end and explore the machine that does the work is always a helpful skill to have… .

Learning objectives:

  • We’ll learn how to check how far along a process is when it is calculating depthmaps and giving no feedback
  • Along the way, we’ll also learn how to look at the docker images running for WebODM and
  • login to said docker images in order to
  • inspect that status of processing data.
  • Let’s go!

So, you threw a really big dataset at WebODM, and now you are waiting. It’s been hours, maybe days, and it’s stuck on the dreaded “Reconstructing all views”:

Did you make the depthmap resolution really high, because you wanted really detailed data? Did you make it too high? How long is this going to take?

I have had this dilemma too. Sometimes I just get disgusted with myself and my predilection for choosing ridiculously computationally expensive settings, kill the process, turn the settings down a bit, and restart. But this can waste hours or days of processing, which feels wrong.

The alternative

We could do the alternative. We could poke under the hood of WebODM and see how it’s progressing. For this project that’s been running for 146+ hours, this is what I decided to do.

The depthmaps that are running are being done in MVE, which can give us really detailed information about progress, but unfortunately, it makes logs a real mess, so we have it logging nothing. Let’s see how we can get around this and check in our status.

Finding the docker instance and logging in:

First, we log into the machine where WebODM is running. We need a list of the existing docker machines, as we need access to the correct machine to look at how things are progressing.

docker ps

The result should give us something like this:

CONTAINER ID        IMAGE                        COMMAND                  CREATED             STATUS              PORTS                                         NAMES
4b0659fe6761        opendronemap/webodm_webapp   "/bin/bash -c 'chmod…"   38 hours ago        Up 38 hours         0.0.0.0:443->8000/tcp, 0.0.0.0:80->8080/tcp   webapp
0e26ebf918f2        opendronemap/webodm_webapp   "/bin/bash -c '/webo…"   38 hours ago        Up 38 hours                                                       worker
1954c5136d44        redis                        "docker-entrypoint.s…"   38 hours ago        Up 38 hours         6379/tcp                                      broker
bdc69502ca50        opendronemap/webodm_db       "docker-entrypoint.s…"   38 hours ago        Up 38 hours         0.0.0.0:32769->5432/tcp                       db
81f401a0e138        opendronemap/nodeodm         "/usr/bin/nodejs /va…"   38 hours ago        Up 38 hours         0.0.0.0:3000->3000/tcp                        webodm_node-odm_1

We want to access the webodm_node-odm_1 node, in most cases. To do this we use docker exec as follows:

docker exec -it webodm_node-odm_1 bash
root@81f401a0e138:/var/www#

Woah! We are now inside the node!

Checking the available data directories:

Typically, if we only have one process running, there will only be one dataset in the /var/www/data directory

cd /var/www/data/99002823-c48b-4af5-af1b-c0fef2ed8b56/

Checking our depthmap data from MVE:

For depthmaps nearly complete in MVE, there will be a file called depth-L1.mvei. We need to find out how many these are as compared with the number of images that we need depthmaps for. We’ll use a combination of the find command and wc (or word count):

find . -name depth-L1.mvei | wc -l

In my case, I have 2,485 images, or roughly 2/3s of my images processed. Looks like I am 6 days into a 9 day process before we get done with the MVE step.

I guess I will wait until Monday to check again… .

Reconstructing cliffs in OpenDroneMap, or how to beat LiDAR at its own game (part 2)


(Reposted from smathermather.com)

In the beginning

In a previous blog post, we explored how we can quite effectively derive terrain models using drones over deciduous, winter scenes. We ran into some limitations in the quality of the terrain model: the challenge was removing the unwanted features (things like tree trunks) while retaining wanted features (large rock features).

I concluded the post thusly:

For our use case, however, we can use the best parameters for this area, take a high touch approach, and create a really nice map of a special area in our parks for very low cost. High touch/low cost. I can’t think of a sweeter spot to reach.

Good parameters for better filtering

In the end, the trick was to extract as good of a depthmap as possible depthmap-resolution: 1280 in my case, set the point cloud filtering (Simple Morphological Filter or SMRF) smrf-window and smrf-threshold to 3 meters to only filter things like tree trunks, and set ignore-gsd: true to ensure we are keeping the highest quality data all the way through the toolchain.

Full list of processing settings:

smrf-window: 3, mesh-octree-depth: 11, orthophoto-resolution: 1.8, dtm: true, dem-resolution: 7, ignore-gsd: true, dsm: true, max-concurrency: 8, camera-lens: brown, depthmap-resolution: 1280, smrf-threshold: 3, rerun-from: dataset

Results

How well do the new settings work? Here’s the old vs. the new, including contours:

Comparison of old and new settings showing much smoother terrain model and contours

This is a much less noisy result. Unfortunately, I ran it at the wrong resolution, so I am rerunning at full resolution now and hope to see something similar.


Reconstructing cliffs in OpenDroneMap, or how to beat LiDAR at its own game


From the top of Whipps Ledges at Hinckley Reservation on November 16, 2016 (Kyle Lanzer/Cleveland Metroparks)

Reposted from smathermather.com

LiDAR and photogrammetric point clouds

If we want to understand terrain, we have a pricey solution and an inexpensive solution. For a pricey and well-loved solution, LiDAR is the tool of choice. It is synoptic, active (and therefore usable day or night), increasingly affordable (but still quite expensive), and works around even thick and tall evergreen vegetation (check out Oregon’s LiDAR specifications as compared with US federal ones, and you’ll understand that sometimes you have to turn the LiDAR all the way up to 11 to see through vegetation).

For a comparably affordable solution, photogrammetrically derived point clouds and the resultant elevation models like the ones we get from OpenDroneMap are sometimes an acceptable compromise. Yes, they don’t work well around vegetation in thickets and forests, and other continuous vegetation covers, but with a few hundred dollar drone, a decent camera, and a bit of field time, you can quickly collect some pretty cool datasets.

As it turns out, sometimes we can collect really great elevation datasets derived from photogrammetry under just the right conditions. More about that in a moment: first let’s talk a little about the locale:

Sharon Conglomerate and Whipps Ledges, Hinckley Reservation

One of my favorite rock formations in Northeast Ohio is Sharon Conglomerate. A mix of sandstone and proper conglomerate, Sharon is a stone in NEO that provides wonderful plant and animal habitats, and not coincidentally provides a source of coldwater springs, streams, and cool wetland habitats across the region. A quick but good overview of the geology of this formation can be found here:

Mapping conglomerate

One of the conglomerate outcrops in Cleveland Metroparks is Whipps Ledges in Hinckley Reservation. It’s a favorite NEO climbing location, great habitat, and a beautiful place to explore. We wanted to map it with a little more fidelity, so we did a flight in August hoping to see and map the rock formations in their glorious detail:

Overall orthophoto of Whipps Ledges from August 2019
Digital surface model of the forest over
Inset image of Whipps Ledges from August 2019
Inset digital surface model of the forest over

Unfortunately, as my geology friends and colleagues like to joke, to map out the conglomerate, we need to “scrape away the pesky green vegetation stuff first”. We don’t want to do this, of course — this is a cool ecological place because it’s a cool geological place! It just happens to be a very well vegetated rocky outcrop. The maple, beech, oak and other trees there take full advantage of the lovely water source the conglomerate provides, so we can’t even glean the benefits of mapping over sparse and lean xeric oak communities: this is a lush and verdant locale.

So yesterday, we flew Whipps Ledges again, but this time the leaves were off the trees. It can be a challenge still to get a good sense of the shape of the landform, even with leafless trees: forest floors do not provide good contrast with the trees above them, and it can be difficult to get good reconstructions of the terrain.

But yesterday, we were lucky: there was a thin layer of snow everywhere providing the needed contrast without being too thick to distort the height of the forest floor too much; shadows from the low sun created great textures on the featureless snow that could be used in matching.

Image above the snowy forest on Whipps Ledges

The good, the bad, and the spectacular

The bad…

So, how are the results? Let’s start with the bad. The orthophoto is a mess. There’s actually probably very little technically wrong with the orthophoto: the stitching is good, the continuity is excellent, the variation between scenes non-existent, the visual distortions minimal. But, it’s a bad orthophoto in that between the high contrast between the trees and the snow compounded with the shadows from the low, nearly cloudless sky result in a difficult to read and noisy orthophoto. Bad data for an orthophoto in; bad orthophoto out.

Orthophoto from December 21 flight

The good

The orthophoto wasn’t our priority for these flights, however. We were aiming for good elevation models. How is our Digital Terrain Model (DTM)? It’s pretty good.

Photogrammetrically derived digital terrain model from drone imagery

The DTM looks good on it’s own, and even compares quite favorably with a (admittedly dated, 2006) LiDAR dataset. It is crisp, shows the cliff features better than the LiDAR dataset, and represents the landform accurately:

Comparison of crisp and cliff-like OpenDroneMap digital terrain model and the blurry LiDAR dtm.

The spectacular

So, if the ortho is bad and the DTM is good, what is great? The DSM is quite nice:

Overview of digital Surface Model from December 21 flight

The DSM looks great. We get all the detail over the area of interest, each cliff face and boulder show up clearly in the escarpment.

Constraining the elevation range to just those elevation around the conglomerate outcrop.
Constraining the elevation range to just those elevation around the conglomerate outcrop , inset 1
Constraining the elevation range to just those elevation around the conglomerate outcrop , inset 2

Improvements in the next iteration

The digital surface model is really quite wonderful. In it we can see many of the major features of the formation, including named features like The Island, a clear delineation of the Main Wall and other features that don’t show in the existing terrain models.

Due to untuned filtering parameters, we filter out more of the features than we’d like in the terrain model itself. It would be nice to keep The Island and other smaller rocks that have separated from the primary escarpment. I expect that when we choose better parameters for deriving the terrain model from the surface model points, we can strike a good balance and get an even better terrain model.

Animation comparing digital surface model and digital terrain model showing the loss of certain core features to Whipps Ledges due to untuned filtering parameters in the creation of the terrain model.

Beating LiDAR at it’s own game

It is probably not fair to say we beat LiDAR at it’s own game. The LiDAR dataset we have to compare to is 13 years old, and a lot has improved in the intervening years. That said, with a $900 drone, free software, 35 minutes of flying, and two batteries, we reconstructed a better terrain model for this area than the professional version of 2006.

And we have control over all the final products. LiDAR filtering tends to remove features like this regardless of point density, because The Island and similar formations are difficult to distinguish in an automated fashion from buildings. Tune the model for one, and you remove the other.

For our use case, however, we can use the best parameters for this area, take a high touch approach, and create a really nice map of a special area in our parks for very low cost. High touch/low cost. I can’t think of a sweeter spot to reach.

Choosing good OpenDroneMap parameters


Introduction

I had an interesting question recently at a workshop: “What parameters do you use for OpenDroneMap?” Now, OpenDroneMap has a lot of configurability, lots of different parameters, and it can be difficult to sift through to find the right parameters for your dataset and use case. That said, the defaults tend to work pretty well for many projects, so I suspect (and hope) there are a lot of users who never have to worry much about these.

The easiest way to proceed, is to use some of the pre-built defaults in WebODM. These drop downs let you take advantage of the combination of a few different settings abstracted away for convenience, whether settings for processing Multispectral data, doing a Fast Orthophoto, flying over Buildings or Forest, etc.

You can also save your own custom settings. You will see at the bottom of this list “Steve’s Default”. This has a lot of the settings I commonly tweak from defaults.

Back to the question at hand: what parameters do I change and why? I’ll talk about 7 parameters that I regularly or occasionally change.

The Parameters

Model Detail

Occasionally we require a little more detail (sometimes we also want less!) in our 3D models from OpenDroneMap. Mesh octree depth is one of the parameters that helps control this. A higher number gives us higher detail. But, there are limits to what makes sense to set for this. I usually don’t go any higher than 11 or maybe 12.

Sylvain Lefebvre - PhD thesis

Elevation Models

DTM/DSM

Often with a dataset, I want to calculate a terrain model (DTM) or surface model (DSM) or both as part of the products. To ensure these calculate, we set the DTM and DSM flags. The larger category for DTM and DSM is Digital Elevation Model, or DEM. All flags that affect settings for both DTM and DSM are named accordingly.

Ignore GSD

OpenDroneMap often does a good job guessing what resolution our orthophoto and DEMs should be. But it can be useful to specify this and override the calculations if they aren’t correct. ignore-gsd is useful for this.

DEM Resolution

DEM Resolution applies to both DTMs and DSMs. A criterion that is useful to follow for this setting is 1/4th the orthophoto resolution. So, if you flew the orthophoto at a height that gives you 1cm resolution ortho imagery, your dem-resolution should probably be 4cm.

Depthmaps

Depthmap resolution

A related concept is depthmap resolution. Depthmaps can be thought of as little elevation models from the perspective of each of the image pairs. The resolution here is set in image space, not geographic coordinates. For Bayer style cameras (most cameras), aim for no more than 1/2 the linear resolution of the data. So if your data are 6000×4000 pixels, you don’t want a depthmap value greater than 3000.

That said, usually, 1/4 is a better, less noisy value, and depthmap calculations can be very computationally expensive. I rarely set this above 1024 pixels.

Camera Lens Type

I saved the best for last here. So, if you’ve made it this far in the blog post, this is the most important tip. In 2019, OpenSfM, our underlying Structure from Motion library, introduced the Brown-Conrady camera model as an option. The default for camera type is auto, which usually results in the use of a perspective camera, but Brown-Conrady is much better. Set your camera-lens to brown, and you will get much better results for most datasets. If it throws an error (which does happen with some images), just switch it back to auto and rerun. Brown will be a default in the near future.

OpenDroneMap Update: Cloud Optimized GeoTIFFs, Plant Health, Histograms and More!


WebODM 1.2.0 has been released today. This is a major release update that brings some shiny new features to the platform, most importantly a large effort to write a dynamic tiling system (powered in large part by rio-cogeo and rio-tiler, thank you Vincent Sarago for the great software!) They include:

Cloud Optimized GeoTIFF support

COGs are “regular GeoTIFF files, aimed at being hosted on a HTTP file server, with an internal organization that enables more efficient workflows on the cloud.”. Sounds like a perfect match for WebODM. This feature in fact has been on the TODO list since mid-2018.

But what are “efficient workflows”? In WebODM’s case, the primary goal of using COGs is dynamic tiling; once we store our maps and elevation models using COGs, we can display (and manipulate) them in real time before serving them to end users. Which means no more static tiles and a lot of cool new features, such as plant health algorithms, dynamic hillshading, histograms, levels and color maps!

Plant Health

This feature has been asked over and over by our community members (we hear you!). We finally added support for Plant Health algorithms. The current list of algorithms is probably not comprehensive, but we made sure to set it up in a straightforward manner to allow for contributions even from non-developers. We look forward for feedback from the community for the addition of more algorithms.

People can apply the plant health algorithms to JPG images that were captured with a spectral filter. We are working to add full support for .TIFF inputs (both 8bit and 16bit) and for multi-camera captures, which will land in ODM within the next few months.

Histograms, Hillshading and Color Maps

Thanks to dynamic tiling we can now visualize rasters statistics with histograms (showing the distribution of values). We can also change colors and enable hillshading on-demand.

We can also stretch the color distribution to visualize better looking orthophotos (this feature is called levels in programs such as GIMP that do image editing).

Left: default orthophoto. Right: Histogram levels adjusted to stretch color distribution.

We are just scratching the surface of what we can do with dynamic tiles. Another cool thing we can do is choose a discrete color map (Pastel) and apply it to an elevation model.

Which highlights areas of similar elevation.

New Icons

We’ve updated the look of WebODM to use the newer version of Font Awesome! If you find missing icons, please let us know, it was a tricky upgrade to perform and we might have missed a few.

Take a moment to share this post with your followers on social media and update your copy of WebODM. As usual report any issues on GitHub.